Microsoft Power BI analysis provided by LCHF Matt. Dates are displayed as day/month/year.
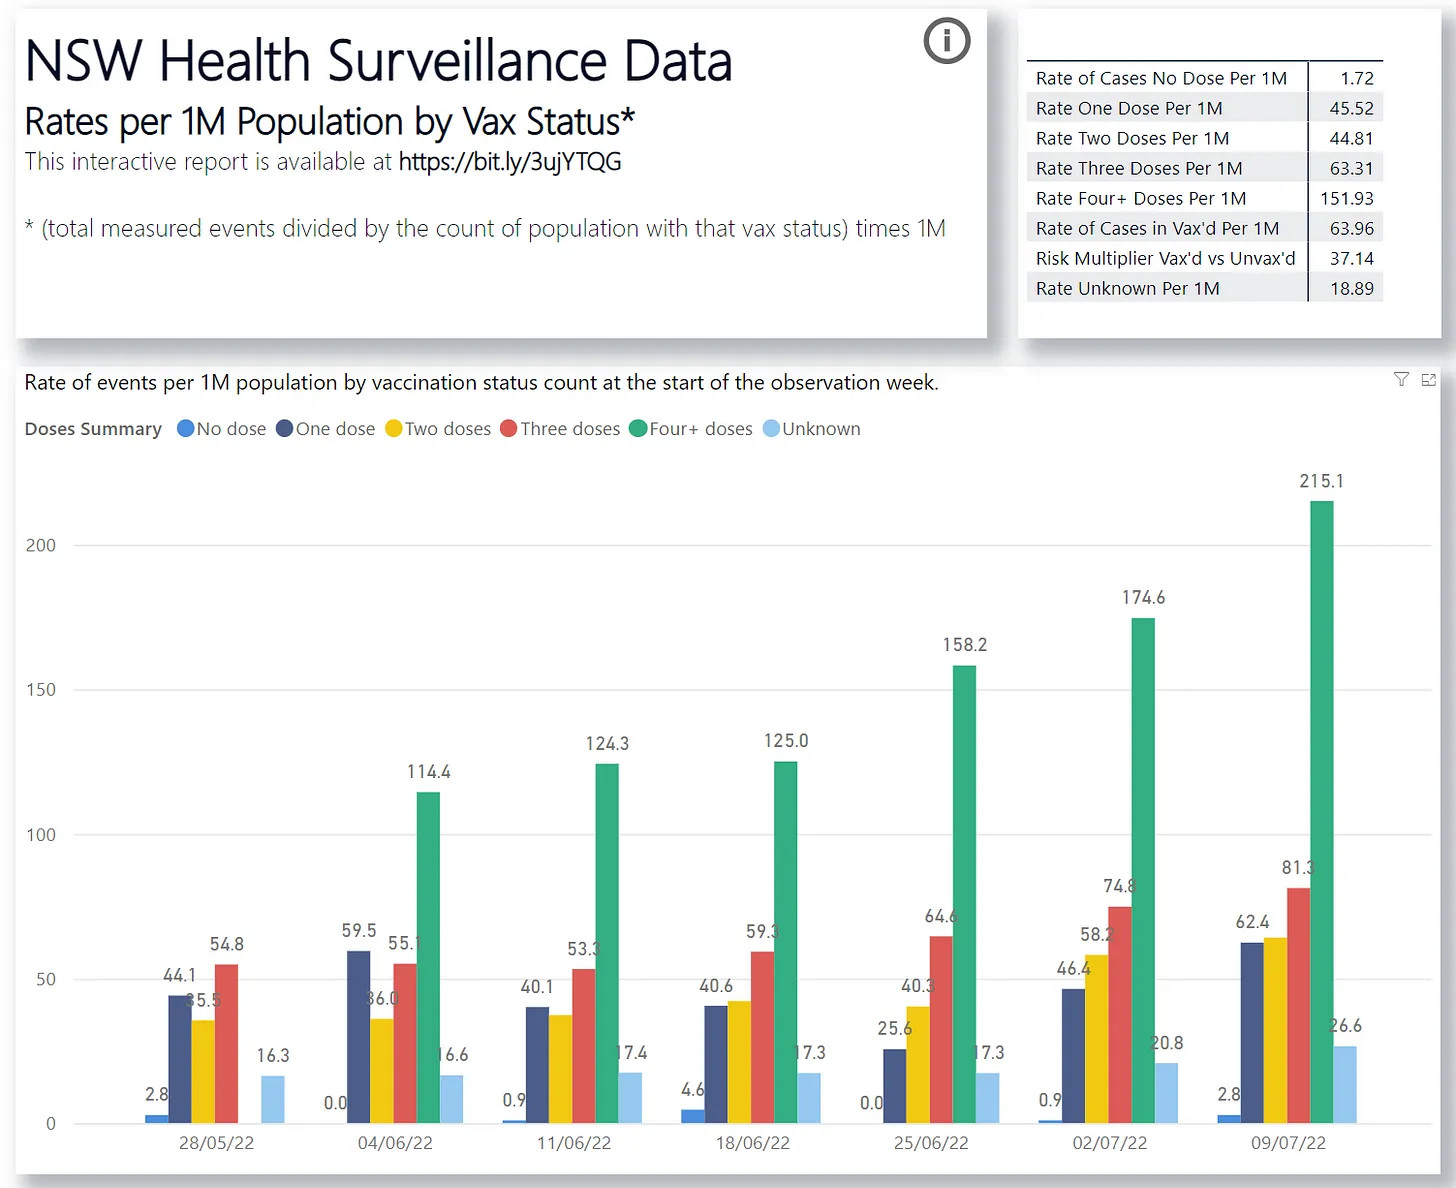
According to their own data (above), in the last seven weeks, you are 37 times more likely to be hospitalised with COVID if you are vaccinated than if you are not.
The chart is the result of analyzing data from New South Wales Health. This data was provided by the government of New South Wales, Australia. This chart shows that the more vaccinated a person is, the higher their risk of hospitalization. Those tall green bars show the rate of hospitalization for those who have taken four or more doses of the jabs.
Sources:
- July 19, 2022. Joel Smalley. “New South Wales, Australia COVID Update Proves the Pandemic of the Vaccinated.” Dead Man Talking.

https://metatron.substack.com/p/new-south-wales-australia-covid-update.
Blog. - LCHF Matt [https://twitter.com/lchf_matt]. “NSW Health Surveillance Data: Rates per 1M Population by Vax Status.” Microsoft Power BI.

https://bit.ly/3ujYTQG.
Social Media.
This is an analysis of hospitalization rates. This chart is updated periodically. - July 28, 2022. “NSW Respiratory Surveillance Reports – COVID-19 and Influenza – COVID-19 (Coronavirus).” NSW Health.

https://www.health.nsw.gov.au/Infectious/covid-19/Pages/weekly-reports.aspx.
Government. - “People Vaccinated NSW Historical.” CovidBaseAU.

https://covidbaseau.com/historical/.
General Website Link.
This chart is updated periodically. - July 29, 2022. Del Bigtree and Jefferey Jaxen. ARE THE BOOSTED PROLONGING THE PANDEMIC? The HighWire with Del Bigtree. Runtime: 14:12.

https://rumble.com/v1e37f5-are-the-boosted-prolonging-the-pandemic.html.
Video.
The reporting of the NSW data begins at 9:25.